class: title-slide, center, middle # Introduction to the Tidyverse --- # Tidyverse The `tidyverse` is an opinionated collection of R packages designed for data science. All packages share an underlying design philosophy, grammar, and data structures. -- *** These packages are designed to support the natural workflow of any data analysis project, as depicted below .center[ <img src="images/data_science_workflow.png" width="689" /> ] .footnote[Image from [R for Data Science](https://r4ds.had.co.nz/introduction.html)] --- # Core tidyverse packages <img src="images/tidyverse_package_load.png" width="2509" /> --- # Core tidyverse packages .center[ <img src="images/tidyverse_packages.png" width="2516" /> ] .footnote[Image from [Sylvia Canelón](https://github.com/spcanelon/2020-rladies-chi-tidyverse)] --- # Core tidyverse packages .center[ <img src="images/tidyverse_packages_purpose.png" width="90%" /> ] .footnote[Image from [Mine Çetinkaya-Rundel](https://education.rstudio.com/blog/2020/07/teaching-the-tidyverse-in-2020-part-1-getting-started/)] --- background-image: url(images/hex/readr.png) background-position: 90% 5% background-size: 10% .footnote[Slide adapted from [Sylvia Canelón](https://github.com/spcanelon/2020-rladies-chi-tidyverse)] # `readr` .panelset[ .panel[.panel-name[Overview] .pull-left[ Importing data is the very first step! <br/> You can use `readr` to import rectangular data. ] .pull-right[ Functions for different file types + comma separated (CSV) files with `read_csv()` + tab separated files with `read_tsv()` + general delimited files with `read_delim()` + fixed width files with `read_fwf()` + tabular files where columns are separated by white-space with `read_table()` + web log files with `read_log()` ] ] .panel[.panel-name[Cheatsheet] 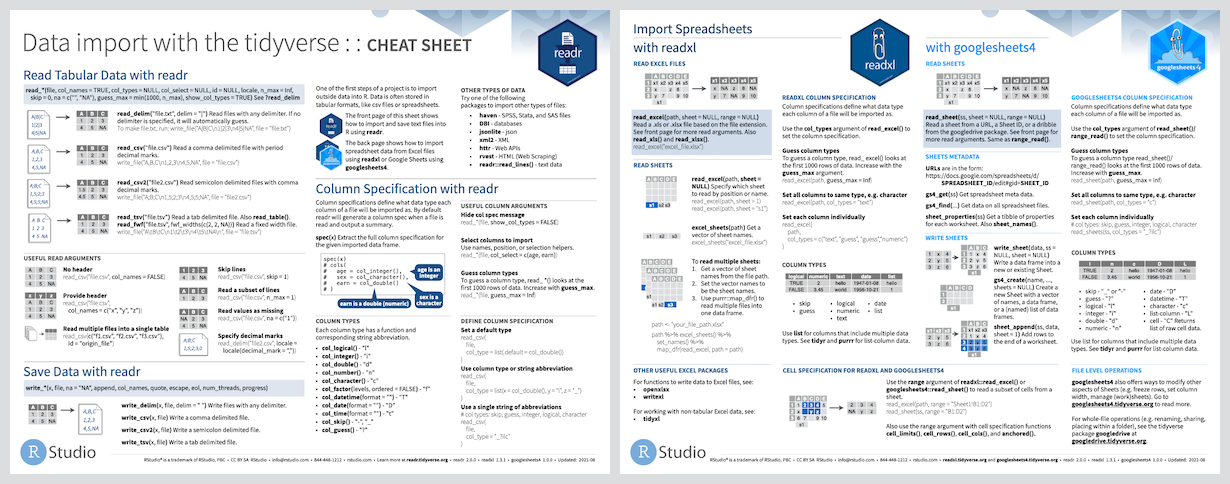 <i class="fas fa-file-pdf "></i> [Download PDF](https://github.com/rstudio/cheatsheets/raw/master/data-import.pdf) ] .panel[.panel-name[Reading] .left-column[ <img src="images/r4ds-cover.png" width="667" /> ] .right-column[ ## [Ch 11: Data import](https://r4ds.had.co.nz/data-import.html) ] ] .panel[.panel-name[Reference] <iframe src="https://readr.tidyverse.org/" width="100%" height="400px"></iframe> ] ] --- background-image: url(images/hex/tibble.png) background-position: 90% 5% background-size: 10% .footnote[Slide adapted from [Sylvia Canelón](https://github.com/spcanelon/2020-rladies-chi-tidyverse)] # `tibble` .panelset[ .panel[.panel-name[Overview] .pull-left[ A `tibble` is much like the data frame in base R, but optimized for use in the tidyverse. Among other features, it has nicer printing methods. ] ] .panel[.panel-name[Cheatsheet]  <i class="fas fa-file-pdf "></i> [Download PDF](https://github.com/rstudio/cheatsheets/raw/master/data-import.pdf) ] .panel[.panel-name[Reading] .left-column[ <img src="images/r4ds-cover.png" width="667" /> ] .right-column[ ## [Ch 10: Tibbles](https://r4ds.had.co.nz/tibbles.html) ] ] .panel[.panel-name[Reference] <iframe src="https://tibble.tidyverse.org/" width="100%" height="400px"></iframe> ] ] --- background-image: url(images/hex/ggplot2.png) background-position: 90% 5% background-size: 10% .footnote[Slide adapted from [Sylvia Canelón](https://github.com/spcanelon/2020-rladies-chi-tidyverse)] # `ggplot2` .panelset[ .panel[.panel-name[Overview] `ggplot2` uses the "Grammar of Graphics" to create a plot. Check out some examples of what's possible from the [ggplot2 extensions gallery](https://exts.ggplot2.tidyverse.org/gallery/). <iframe src="https://exts.ggplot2.tidyverse.org/gallery/" width="100%" height="325px"></iframe> ] .panel[.panel-name[Cheatsheet] 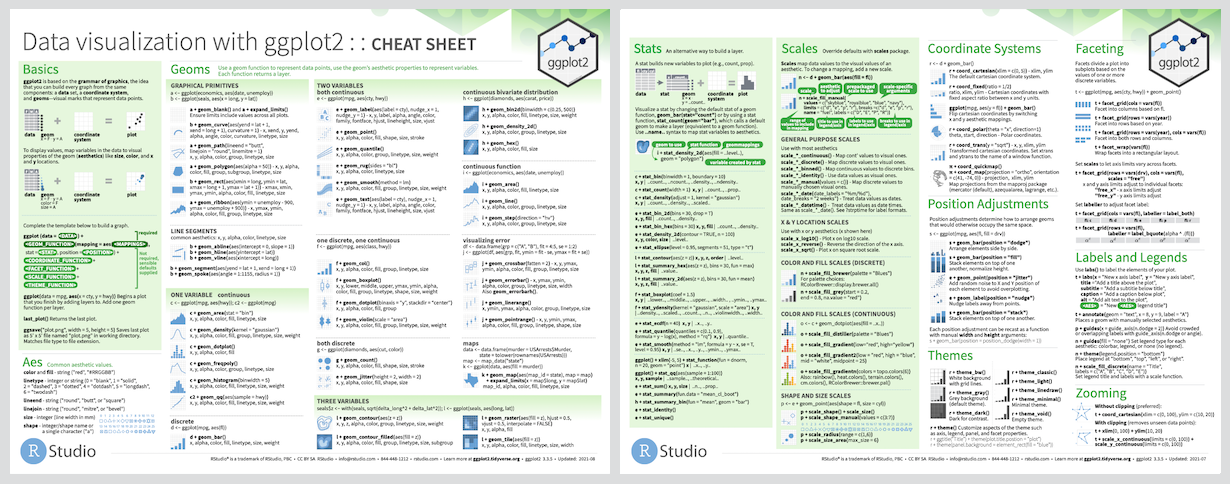 <i class="fas fa-file-pdf "></i> [Download PDF](https://github.com/rstudio/cheatsheets/raw/master/data-visualization-2.1.pdf) ] .panel[.panel-name[Reading] .left-column[ <img src="images/r4ds-cover.png" width="667" /> ] .right-column[ ## [Ch 3: Data visualization](https://r4ds.had.co.nz/data-visualisation.html) ] ] .panel[.panel-name[Reference] <iframe src="https://ggplot2.tidyverse.org/" width="100%" height="400px"></iframe> ] ] --- background-image: url(images/hex/dplyr.png) background-position: 90% 5% background-size: 10% .footnote[Slide adapted from [Sylvia Canelón](https://github.com/spcanelon/2020-rladies-chi-tidyverse)] # `dplyr` .panelset[ .panel[.panel-name[Overview] .pull-left[ `dplyr` includes a host of functions that perform specific and incremental data transformation steps to help you to wrangle your data into exactly the right form you need. ] .pull-right[ + Pick observations by their values with `filter()`. + Reorder the rows with `arrange()`. + Pick variables by their names `select()`. + Create new variables with functions of existing variables `mutate()`. + Collapse many values down to a single summary `summarize()`. ] ] .panel[.panel-name[Cheatsheet] 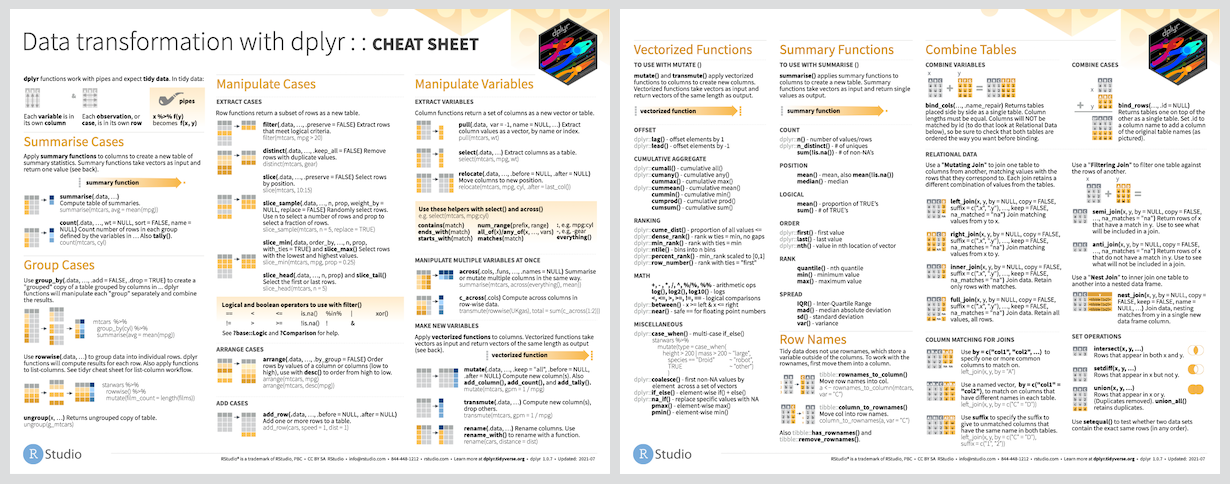 <i class="fas fa-file-pdf "></i> [Download PDF](https://github.com/rstudio/cheatsheets/raw/master/data-transformation.pdf) ] .panel[.panel-name[Reading] .left-column[ <img src="images/r4ds-cover.png" width="667" /> ] .right-column[ ## [Ch 5: Data transformation](https://r4ds.had.co.nz/transform.html) ] ] .panel[.panel-name[Reference] <iframe src="https://dplyr.tidyverse.org/" width="100%" height="400px"></iframe> ] ] --- background-image: url(images/hex/forcats.png) background-position: 90% 5% background-size: 10% .footnote[Slide adapted from [Sylvia Canelón](https://github.com/spcanelon/2020-rladies-chi-tidyverse)] # `forcats` .panelset[ .panel[.panel-name[Overview] .pull-left[ `forcats` is great for working with **categorical variables** or factors. ] .pull-right[ A few key functions: + `fct_reorder()`: Reordering a factor by another variable + `fct_infreq()`: Reordering a factor by the frequency of values + `fct_relevel()`: Changing the order of a factor by hand + `fct_lump()`: Collapsing the least/most frequent values of a factor into “other” ] ] .panel[.panel-name[Cheatsheet] .center[ <img src="https://raw.githubusercontent.com/rstudio/cheatsheets/master/pngs/thumbnails/forcats-cheatsheet-thumbs.png" width="60%" /> <i class="fas fa-file-pdf "></i> [Download PDF](https://github.com/rstudio/cheatsheets/raw/master/factors.pdf) ] ] .panel[.panel-name[Reading] .left-column[ <img src="images/r4ds-cover.png" width="667" /> ] .right-column[ ## [Ch 15: Factors](https://r4ds.had.co.nz/factors.html) ] ] .panel[.panel-name[Reference] <iframe src="https://forcats.tidyverse.org/" width="100%" height="400px"></iframe> ] ] --- background-image: url(images/hex/stringr.png) background-position: 90% 5% background-size: 10% .footnote[Slide adapted from [Sylvia Canelón](https://github.com/spcanelon/2020-rladies-chi-tidyverse)] # `stringr` .panelset[ .panel[.panel-name[Overview] .pull-left[ `stringr` helps us manipulate strings! The package includes many functions to help us with **regular expressions**, which are a concise language for describing patterns in strings. ] .pull-right[ `stringr` allows you to - detect matches - subset strings - manage string lengths - mutate strings - join and split strings - order strings - ...and more! ] ] .panel[.panel-name[Cheatsheet] 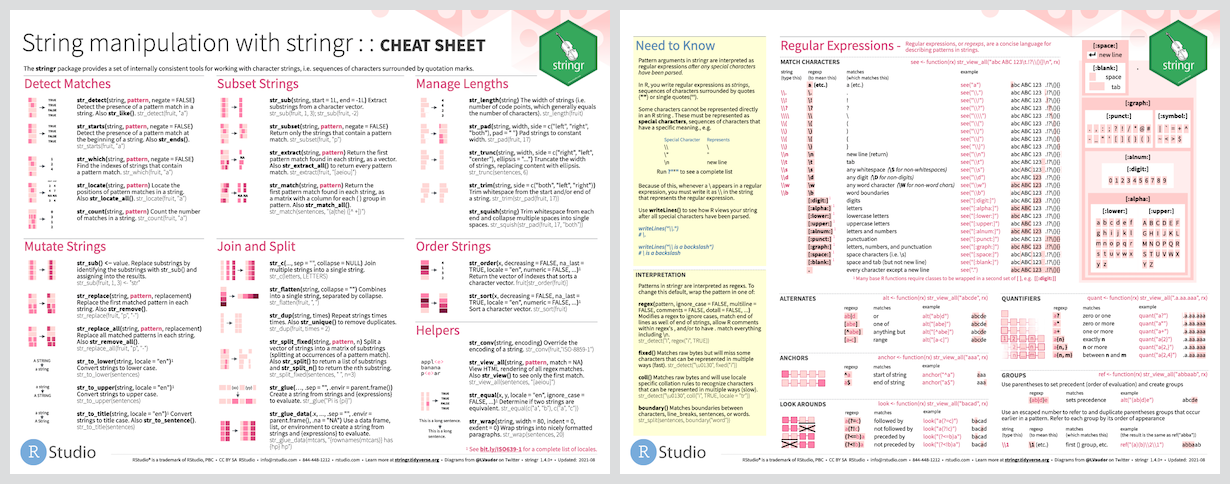<!-- --> <i class="fas fa-file-pdf "></i> [Download PDF](https://github.com/rstudio/cheatsheets/raw/master/strings.pdf) ] .panel[.panel-name[Reading] .left-column[ <img src="images/r4ds-cover.png" width="667" /> ] .right-column[ ## [Ch 14: Strings](https://r4ds.had.co.nz/strings.html) ] ] .panel[.panel-name[Reference] <iframe src="https://stringr.tidyverse.org/" width="100%" height="400px"></iframe> ] ] --- background-image: url(images/hex/tidyr.png) background-position: 90% 5% background-size: 10% .footnote[Slide adapted from [Sylvia Canelón](https://github.com/spcanelon/2020-rladies-chi-tidyverse)] # `tidyr` .panelset[ .panel[.panel-name[Overview] .pull-left[ `tidyr` allows you to reshape raw "untidy" data into a "tidy" format. Here is an example of what a tidy dataframe looks like:  ] .pull-right[ There are three interrelated rules which make a dataset tidy: - Each variable must have its own column. - Each observation must have its own row. - Each value must have its own cell. ] ] .panel[.panel-name[Cheatsheet] <!-- --> <i class="fas fa-file-pdf "></i> [Download PDF](https://github.com/rstudio/cheatsheets/raw/master/data-import.pdf) ] .panel[.panel-name[Reading] .left-column[ <img src="images/r4ds-cover.png" width="667" /> ] .right-column[ ## [Ch 12: Tidy data](https://r4ds.had.co.nz/tidy-data.html) ] ] .panel[.panel-name[Reference] <iframe src="https://tidyr.tidyverse.org/" width="100%" height="400px"></iframe> ] ] --- background-image: url(images/hex/purrr.png) background-position: 90% 5% background-size: 10% .footnote[Slide adapted from [Sylvia Canelón](https://github.com/spcanelon/2020-rladies-chi-tidyverse)] # `purrr` .panelset[ .panel[.panel-name[Overview] .pull-left[ `purrr` provides tools for working with functions and vectors -- in particular, repeating the same operations many times concisely and efficiently The `map()` family of functions helps us replace for loops, <br/> making our code easier to read and more succinct. ] ] .panel[.panel-name[Cheatsheet] .center[ <!-- --> <i class="fas fa-file-pdf "></i> [Download PDF](https://github.com/rstudio/cheatsheets/raw/master/purrr.pdf) ] ] .panel[.panel-name[Reading] .left-column[ <img src="images/r4ds-cover.png" width="667" /> ] .right-column[ ## [Ch 21: Iteration](https://r4ds.had.co.nz/iteration.html) ] ] .panel[.panel-name[Reference] <iframe src="https://purrr.tidyverse.org/" width="100%" height="400px"></iframe> ] ] --- class: inverse, center, middle # Q & A <div class="countdown" id="timer_5f6c28af" style="right:0;bottom:0;" data-warnwhen="0"> <code class="countdown-time"><span class="countdown-digits minutes">05</span><span class="countdown-digits colon">:</span><span class="countdown-digits seconds">00</span></code> </div> --- class: inverse, center, middle # Next up... ## Importing data & Project-oriented workflows --- class: inverse, center, middle # Break! <div class="countdown" id="timer_5f6c2ab2" style="right:0;bottom:0;" data-warnwhen="0"> <code class="countdown-time"><span class="countdown-digits minutes">05</span><span class="countdown-digits colon">:</span><span class="countdown-digits seconds">00</span></code> </div>