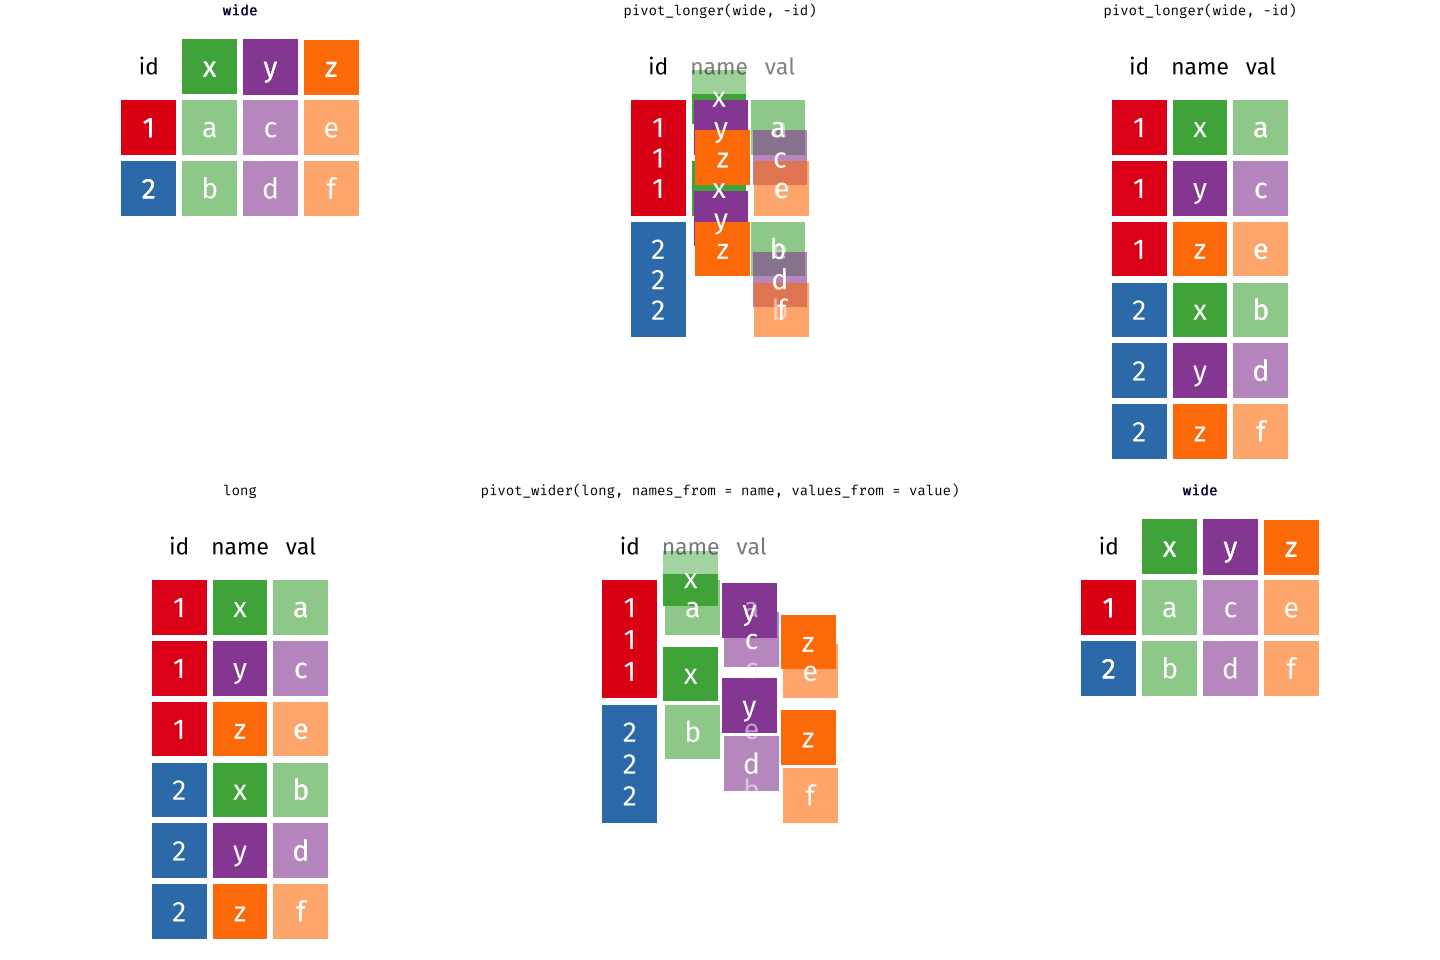
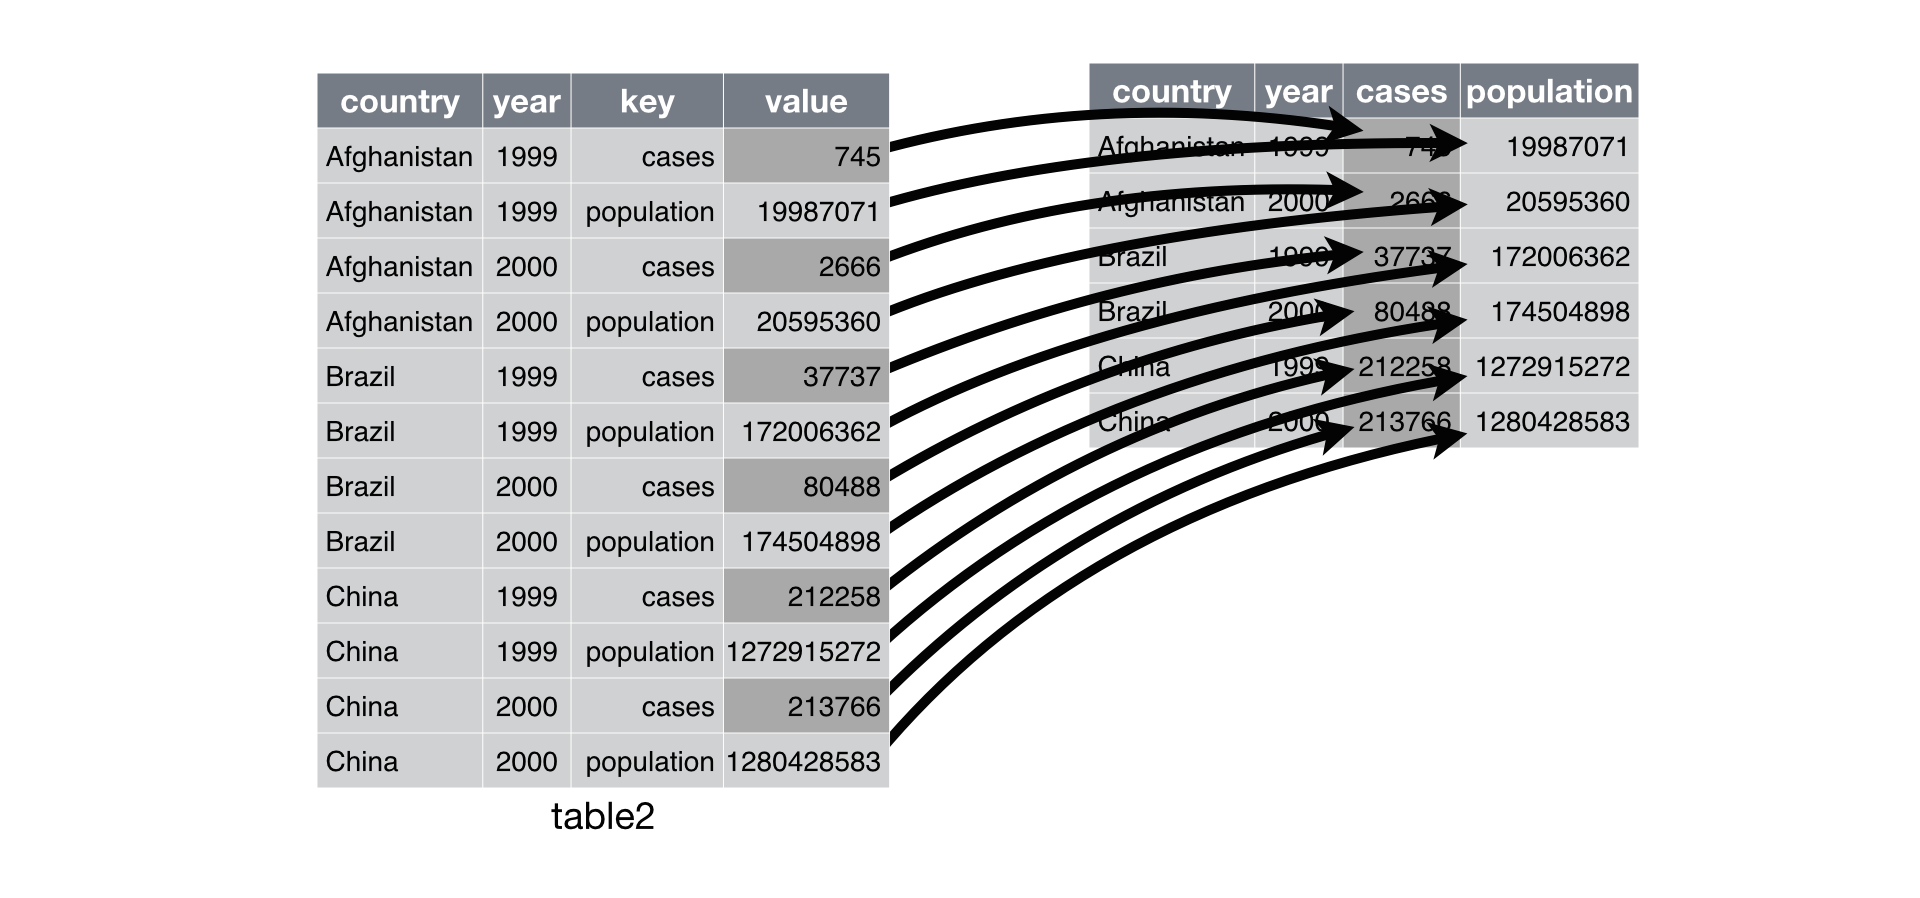
class: title-slide, center, middle # Data Reshaping with `tidyr` --- # What is "tidy" data? There are three interrelated rules which make a dataset tidy -- 1. Each variable must have its own column. 1. Each observation must have its own row. 1. Each value must have its own cell. -- Here's an image that shows these rules visually <img src="images/tidy_data.png" width="2560" /> .footnote[Source: [R for Data Science](https://r4ds.had.co.nz/tidy-data.html#tidy-data-1)] --- class: inverse, center, middle # Pivoting --- background-image: url(images/hex/tidyr.png) background-position: 90% 5% background-size: 10% # Pivoting Most of the data you encounter in the real world will unfortunately most likely not be in tidy format. -- This means you will need to reshape your data in order to tidy it. -- *** This is where the `tidyr` package comes in. It contains two crucial functions that you can use to reshape your data... -- .pull-left[ `pivot_longer()` makes datasets longer by increasing the number of rows and decreasing the number of columns. ] .pull-right[ `pivot_wider()` "widens" data, increasing the number of columns and decreasing the number of rows. ] *** ***Note:*** The old versions of these functions were called `gather()` and `spread()`, but were very confusing to use, and these newer functions are much more user-friendly. --- background-image: url(images/hex/tidyr.png) background-position: 90% 5% background-size: 10% # Pivoting ![](images/tidyr-longer-wider-modified.gif)<!-- --> .footnote[Source: [Mara Averick](https://twitter.com/dataandme/status/1175913657907253254?s=20) and [Garrick Aden-Buie](https://github.com/gadenbuie/tidyexplain)] --- # Example data Our example data is built into to the `tidyr` package. It represents the number of TB cases documented by the World Health Organization in Afghanistan, Brazil, and China between 1999 and 2000 -- *** .pull-left[ We need to reshape this data to a longer format ```r table4a ``` ``` ## # A tibble: 3 x 3 ## country `1999` `2000` ## * <chr> <int> <int> ## 1 Afghanistan 745 2666 ## 2 Brazil 37737 80488 ## 3 China 212258 213766 ``` ] -- .pull-right[ + The column names `1999` and `2000` are not variables in our data, instead they represent values of the year variable + The values in the `1999` and `2000` columns represent values of the `cases` variable + Each row represents two observations, not one ] --- background-image: url(images/hex/tidyr.png) background-position: 90% 5% background-size: 10% # `pivot_longer()` ```r table4a ``` ``` ## # A tibble: 3 x 3 ## country `1999` `2000` ## * <chr> <int> <int> ## 1 Afghanistan 745 2666 ## 2 Brazil 37737 80488 ## 3 China 212258 213766 ``` -- *** We need 3 pieces of information to reshape (pivot) this data into a tidy format -- + The set of columns in `table 4a` whose names are actually values, not variables. In this example, those are the columns `1999` and `2000`. -- + The name of the variable to move the column names to. Here it is `year`. -- + The name of the variable to move the column values to. Here it’s `cases`. --- background-image: url(images/hex/tidyr.png) background-position: 90% 5% background-size: 10% # `pivot_longer()` .panelset[ .panel[.panel-name[Arguments] <code class ='r hljs remark-code'>pivot_longer(<span style="color:cornflowerblue">data</span>, <span style="color:red">cols</span>, <span style="color:purple">names_to</span>, <span style="color:orange">values_to</span>)</code> **.blue[data]** .blue[= A data frame to pivot] **.red[cols]** .red[= Columns to pivot into longer format] **.purple[names_to]** .purple[= A string specifying the name of the column to create from the data stored in the column names of .blue[data]] **.orange[values_to]** .orange[= A string specifying the name of the column to create from the data stored in cell values] ] .panel[.panel-name[Example] ```r table4a %>% pivot_longer(cols = c(`1999`, `2000`), names_to = "year", values_to = "cases") ``` .pull-left[ **Output: A longer data frame** ``` ## # A tibble: 6 x 3 ## country year cases ## <chr> <chr> <int> ## 1 Afghanistan 1999 745 ## 2 Afghanistan 2000 2666 ## 3 Brazil 1999 37737 ## 4 Brazil 2000 80488 ## 5 China 1999 212258 ## 6 China 2000 213766 ``` ] .pull-right[ **Notes** + We had to put the variable names `1999` and `2000` in backticks because column names are normally not allowed to start with numbers + `year` and `cases` do not exist in `table4a` so we put their names in quotes. ] ] .panel[.panel-name[Visualization] Here's a visual representation of what we just did. <img src="images/pivot_longer_example.png" width="2560" /> ] ] --- class: split-60 background-image: url(images/hex/tidyr.png) background-position: 90% 5% background-size: 10% # `pivot_wider()` Below is a different dataset (`table2`) that needs to be reshaped to a wider format. A single observation is a `country` in a `year`, but each observation is spread across two rows. *** .column[ <br> .content[.center[ <br><br><br><br><br><br><br><br><br><br> ``` ## # A tibble: 12 x 4 ## country year type count ## <chr> <int> <chr> <int> ## 1 Afghanistan 1999 cases 745 ## 2 Afghanistan 1999 population 19987071 ## 3 Afghanistan 2000 cases 2666 ## 4 Afghanistan 2000 population 20595360 ## 5 Brazil 1999 cases 37737 ## 6 Brazil 1999 population 172006362 ## 7 Brazil 2000 cases 80488 ## 8 Brazil 2000 population 174504898 ## 9 China 1999 cases 212258 ## 10 China 1999 population 1272915272 ## 11 China 2000 cases 213766 ## 12 China 2000 population 1280428583 ``` ]]] -- .column[ <br><br> .content[ <br><br><br><br><br><br><br><br><br><br> To tidy this up, we need two pieces of information: -The column to take variable names from (`type`) -The column to take values from (`count`) ]] --- background-image: url(images/hex/tidyr.png) background-position: 90% 5% background-size: 10% # `pivot_wider()` .panelset[ .panel[.panel-name[Arguments] <code class ='r hljs remark-code'>pivot_wider(<span style="color:cornflowerblue">data</span>, <span style="color:red">names_from</span>, <span style="color:purple">values_from</span>)</code> **.blue[data]** .blue[= A data frame to pivot] **.red[names_from]** .red[= Which column (or columns) to get the name(s) of the output column(s) from] **.purple[values_from]** .purple[= Which column (or columns) to get the cell values from] ] .panel[.panel-name[Example] ```r table2 %>% pivot_wider(names_from = type, values_from = count) ``` ``` ## # A tibble: 6 x 4 ## country year cases population ## <chr> <int> <int> <int> ## 1 Afghanistan 1999 745 19987071 ## 2 Afghanistan 2000 2666 20595360 ## 3 Brazil 1999 37737 172006362 ## 4 Brazil 2000 80488 174504898 ## 5 China 1999 212258 1272915272 ## 6 China 2000 213766 1280428583 ``` ] .panel[.panel-name[Visualization] Here's a visual representation of what we just did. <img src="images/pivot_wider_example.png" width="2560" /> ] ] --- class: inverse # Your turn 1
05
:
00
1. Import the file `pragmatic_scales_data.csv` (use best practices of a project-oriented workflow). Save it to an object called `ps_data` and convert to a tibble. View the data to remind yourself how it's structured. 1. Use `pivot_wider()` to reformat the data so that there is a unique column for each `item`. The values in each of the four item columns should indicate whether or not the subject got that particular item right or wrong (i.e., what variable represents this?). Save this to a new object called `ps_data_wide`. 1. Take `ps_data_wide`, which you just created, and reshape it back to the original longer format using `pivot_longer()`. --- class: solution # Solution .panelset[ .panel[.panel-name[Q1] ```r # Q1. ps_data <- rio::import(here::here("data", "pragmatic_scales_data.csv")) %>% as_tibble() ``` ] .panel[.panel-name[Q2] ```r # Q2. ps_data_wide <- ps_data %>% pivot_wider(names_from = item, values_from = correct) ps_data_wide ``` ``` ## # A tibble: 150 x 7 ## subid age condition faces houses pasta beds ## <chr> <dbl> <chr> <int> <int> <int> <int> ## 1 M22 2 Label 1 1 0 0 ## 2 T22 2.13 Label 0 1 1 0 ## 3 T17 2.32 Label 0 0 0 0 ## 4 M3 2.38 Label 0 1 1 1 ## 5 T19 2.47 Label 0 0 1 1 ## 6 T20 2.5 Label 1 1 0 1 ## 7 T21 2.58 Label 1 1 1 0 ## 8 M26 2.59 Label 1 1 0 1 ## 9 T18 2.61 Label 1 0 1 0 ## 10 T12 2.72 Label 0 1 0 0 ## # … with 140 more rows ``` ] .panel[.panel-name[Q3] ```r # Q3. ps_data_wide %>% pivot_longer(c(faces, houses, pasta, beds), names_to = "item", values_to = "correct") %>% select(subid, item, correct, everything()) # reorder columns ``` ``` ## # A tibble: 600 x 5 ## subid item correct age condition ## <chr> <chr> <int> <dbl> <chr> ## 1 M22 faces 1 2 Label ## 2 M22 houses 1 2 Label ## 3 M22 pasta 0 2 Label ## 4 M22 beds 0 2 Label ## 5 T22 faces 0 2.13 Label ## 6 T22 houses 1 2.13 Label ## 7 T22 pasta 1 2.13 Label ## 8 T22 beds 0 2.13 Label ## 9 T17 faces 0 2.32 Label ## 10 T17 houses 0 2.32 Label ## # … with 590 more rows ``` ] ] --- class: inverse, center, middle # Q & A
05
:
00
--- class: inverse, center, middle # Next up... ## Reproducible reporting with R Markdown --- class: inverse, center, middle # Break!
10
:
00