Welcome
Introduction and Orientation
Hello 👋
Welcome to the 3rd annual UO Psych R Bootcamp!
Hello 👋
Welcome to the 3rd annual UO Psych R Bootcamp!
The team

Cianna

Cam
Schedule
Day 1: Monday, 9/21, 9 AM - 1 PM PST
- Basics of R & RStudio
- Data Types & Structures
- Functions & Debugging
Day 2: Wednesday, 9/23, 9 AM - 12 PM PST
- Introduction to the tidyverse
- Importing data & Project-oriented workflows
- Data visualization with
ggplot2
Day 3: Friday, 9/25, 9 AM - 1 PM PST
- Data wrangling with
dplyr - Data tidying with
tidyr - Reproducible reporting with R Markdown
A word of encouragement
- R has a substantial learning curve, but...
A word of encouragement
R has a substantial learning curve, but...
- 1) It's absolutely worth it! (I promise)
A word of encouragement
R has a substantial learning curve, but...
1) It's absolutely worth it! (I promise)
2) Everyone goes through this
A word of encouragement
R has a substantial learning curve, but...
1) It's absolutely worth it! (I promise)
2) Everyone goes through this
“There is no way of going from knowing nothing about a subject to knowing something about a subject without going through a period of great frustration and much suckiness.”
-Hadley Wickham,
Chief Scientist at RStudio

What are R & RStudio?
What are R & RStudio?

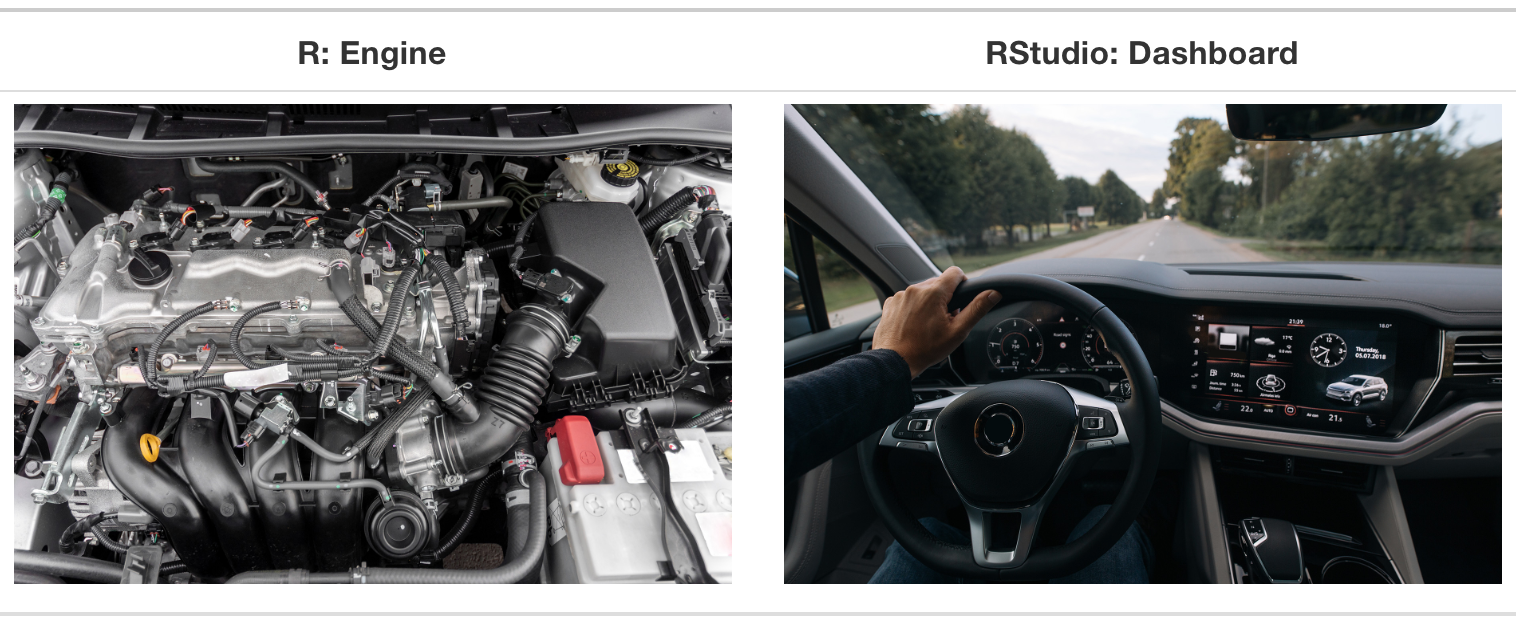
R is a programming language designed for statistics and data science
What are R & RStudio?

R is a programming language designed for statistics and data science

RStudio is an integrated development environment (IDE) that provides an interface to R.
RStudio also refers to the company that develops this software.
Why Use R?
It's open source
Why Use R?
It's open source
- It's free!
Why Use R?
It's open source
It's free!
It's easier to share your data & code
Why Use R?
It's open source
It's free!
It's easier to share your data & code
Innovations spread quickly
Why Use R?
It's open source
It's free!
It's easier to share your data & code
Innovations spread quickly
You can contribute!
Why Use R?
It's powerful & flexible
Why Use R?
It's powerful & flexible
You can use R for more than data analysis, including:
creating websites (including this one!)
creating documents that reproduce your analyses
slideshows (including this one!)
books
web applications
Why Use R?
It's powerful & flexible
You can use R for more than data analysis, including:
creating websites (including this one!)
creating documents that reproduce your analyses
slideshows (including this one!)
books
web applications
In R, it is never if but how...
Why Use R?
It's a useful, transferable skill
Why Use R?
It's a useful, transferable skill
- R is used across many industries, esp. in UX & data science
Why Use R?
Reduce errors, enhance reproducibility & transparency
Why Use R?
Reduce errors, enhance reproducibility & transparency
- Generate publication-quality figures & tables within R, reducing copypasta errors
Why Use R?
Reduce errors, enhance reproducibility & transparency
Generate publication-quality figures & tables within R, reducing copypasta errors
Create detailed and fully documented scripts showing every step between raw data & stats
Why Use R?
Reduce errors, enhance reproducibility & transparency
Generate publication-quality figures & tables within R, reducing copypasta errors
Create detailed and fully documented scripts showing every step between raw data & stats
You can use R to automate reporting of your analyses (for HW or publication), reducing all too common errors in reported statistics see Nuijten et al.
Why Use R?
It's efficient
Why Use R?
It's efficient
- Once you get used to it and start using R, it saves you time in the long run
Why Use R?
It's efficient
Once you get used to it and start using R, it saves you time in the long run
Scripts make re-using past work or using others' work as a starting point much easier
Why Use R?
It's efficient
Once you get used to it and start using R, it saves you time in the long run
Scripts make re-using past work or using others' work as a starting point much easier
Typing scripts is much faster than clicking through menus, especially after you get the hang of keyboard shortcuts
It runs faster and is less bloated than GUI-based statistical software (e.g., SPSS)
It's fun 🥳
No, seriously!
