Data Visualization with {ggplot2}
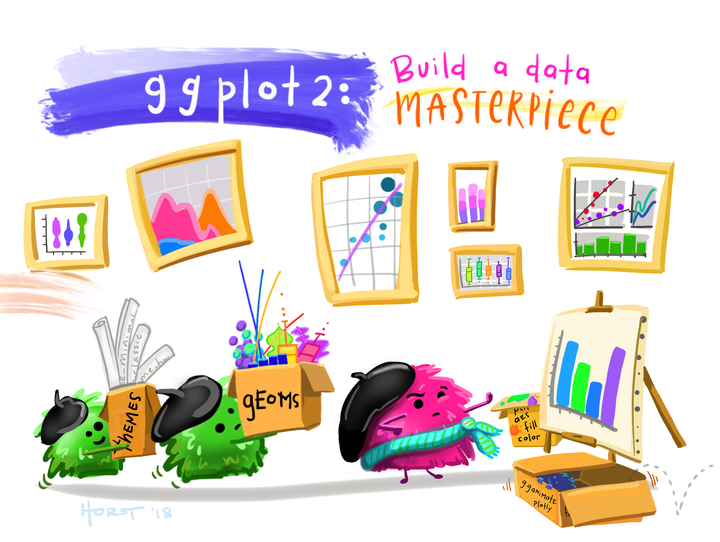
 Artwork by @allison_horst
Data visualization is at the very core of science. In order to understand and glean insights from our data, we need different ways of representing it visually. R has an incredible capacity for creating all sorts of plots, charts, and tables, and today we will only scratch the surface. We will discuss the fundamentals of the powerful ggplot2 package and the “grammar of graphics” that underlies it.
Slides
Further Reading
R for Data Science chapter on data visualization
Modern Dive chapter on data visualization
Cookbook for R chapter on data visualization
the ggplot flipbook by Gina Reynolds – shows how to create plots line-by-line